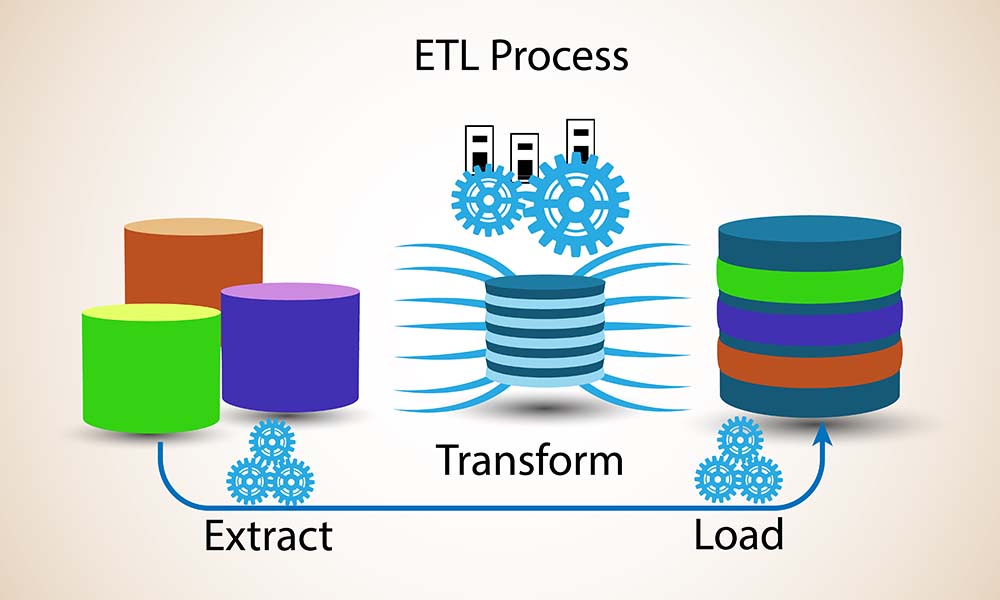
ETL Pipeline with Python and Airtable
A data engineering project involving the development of ETL pipelines using python scripts developed with sublime text and VSCode.
Web crawlers built using Selenium and beautifulsoup frameworks, extracting all available job posts from the career page of the 100
companies listed on Forbes 100 Cloud companies in 2022. The extracted data were cleaned and transformed into data frames using
Pandas, saved as CSV files and batch uploaded to Airtbale database using the Airtable API

SQL Analysis of Tetouan Power Consumption
SQL analysis of the Zonal Power Consumption in Tetouan, a city in Northern Morocco, using Microsoft SQL Server and SQL
Server Management Studio. Queries executed included average power consumption per zone, total power consumption per zone,
monthly average consumption per zone, difference in monthly power consumption to the overall zonal average,
monthly moving average, percentage power consumption, and monthly change in power consumption.
Data Warehouse, Modeling, ETL and BI visualization
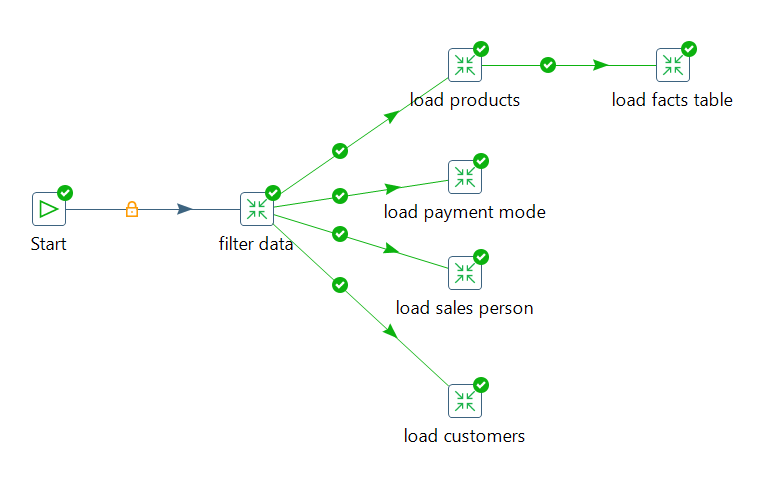
An end-to-end data engineering and analytics project involving data warehousing, data modeling, ETL pipeline, and Power BI
visualization, orchestrated using PostgreSQL, Pentaho Data Integration (PDI) tool, and LucidChart. Facts and dimension tables
were developed using LucidChart and implemented in PostgreSQL using DDL queries.
ETL workflows for extracting, staging, transforming and loading data were developed using PDI.

Predicting Power Consumption in Tetouan
A machine learning project involving training Random Forest and Gradient Method Regression Models to predict the power consumption
in Tetouan. Performed data wrangling and feature engineering with Pandas, NumPy and matplotlib. The final dataset encoded using
the one-hot encoder. An exhaustive analysis was carried out to find patterns and correlations between features in the dataset.
The trained models were evaluated using means squared error, and r2 score.
Data Wrangling: Twitter data
Performed data wrangling using Python libraries - NumPy, Pandas, Seaborn, Matplotlib. Dataset were programmatically downloaded in
a JSON format using request, and twitter API (TweePy), transformed using using Pandas, PIL, and io modules. Programmatic and manual
assessment was performed to determine tidiness and cleanliness issues, which were all resolved. The final dataset was visualized to
gain insights on the most common dog breads, dog stage, and dog names.

Prosper Loan Data Analysis
An exhaustive analysis of the Prosper Loan Company dataset. Contains about 113,000 observations with 81 features. The data was
analyzed to determine relationships between loan amount and the characteristics of borrowers. These characteristics included but
not limited to employment status, loan amount, monthly repayment, income, house owner, and credit rating. The select characteristics
play an important role in determining the default possibility.


